Patent Landscape
Purpose & Use
Patent Landscape is a search to understand a particular technology area. Many companies order patent landscape to create an internal database of relevant patents revolving around the technology of interest. The trends that emerge from patent landscape can be very helpful for taking business decisions, R&D decisions, gaining insights about competitors, helping R&D team and to find out the white spaces in underlying technology. The landscape analysis is most useful while developing a new product or at the time of research and development to identify the gaps in the area of interest. Often, patent landscape is clubbed with non-patent landscape to get a complete picture of the technology.
Process & Reporting
The patent search is carried out on commercial patent and non-patent databases. The search starts with relevant keywords and their synonyms and is followed by a class based search, assignee-inventor search and citation search. Foreign language searches are also conducted. The number of the results depends upon the nature of the invention. Broad or old technologies can lead to thousands of results while narrow or new technologies can lead to hundreds or some time tens of results. Once the search is completed, the results are analyzed thoroughly and the valid results are bucketed under a well thought technology tree also known as taxonomy. The reports in addition to the categorized patents, also contains relevant trends and insights to easily understand the current position of the technology in question that can help taking important decisions. Patent landscape reports are often provided on Signicent’s Patent Dashboard (PatViewTM) which is a web-based analytical platform.
Key Deliverables
We deliver thorough Patent Landscape analysis reports for our clients with tools such as:
-
Taxonomy
Detailed taxonomical categorization for identification of required features of technology in an easy-on-the-eye format
-
Dashboard
Case-customized dashboard, through our in-house developed award-winning Dashboard platform PatView
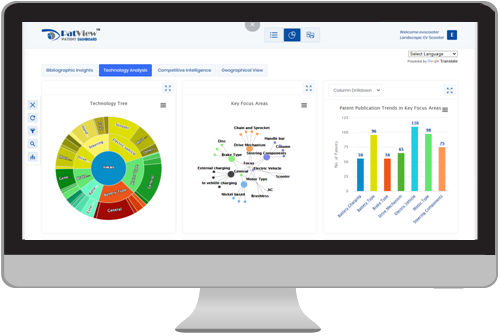
Some unique features of our PatViewTM solution for analysis include:
-
- – Single screen easy navigation among thousands of records in a study
- – Keyword searching for desired/selected bucket of records
- – Multi-level problem solution Taxonomy based categorization of records over technology nodes
- – Ability to edit and re-categorize patents by your own in taxonomy of your choice
- – Dynamic and interactive charts to see trends and corresponding records as you filter results with your own query
- – Ability to add notes as you analyze the results
- – Ability to click and export shortlisted records in Excel or PDF format for easy sharing with team
-
Growth trends
We conduct an analysis showing growth trends of technology of interest, the trends of filing, publication and expected expiry dates of protected technologies which in-turn are of value for recognizing the time-span in which the technology emerged, during which tenure R&D was extensive in comparison to the periods of time wherein research and development was relatively less or if any.
-
Geographical analysis
A detailed geographical analysis which shows distribution of patents designated authority-wisespread throughout specific countries, that can further be categorizedon the basis of country of origin/priority, the geographical distribution of family members and the representative members of the patent family.
-
Competitive Intelligence
Competitive intelligence provides you with an extensive view of the top companies/competitors relevant to the technology under consideration. It embodies suppliers, key manufacturers of core competitors and the publication trends, filing trends and their key focus areas.
-
White space analysis
It offers an insight into areas in the technological landscape where there is scope for improvement by identifying gaps in the technology. For instance there may be fewer solutions for a particular problem, or intense development for one technology and meager development for another. White space analysis identifies these areas and depicts this information in a user friendly format.
-
Heat maps
These are a pictorial representation showing assignee wise geographical distribution of patents which gives you a precise estimate of which assignees/companies/manufacturers to consider in each country that they have their patents in.
-
SWOT analysis
Our analysis includes identifying the strengths, weaknesses, opportunities and threats relevant to the field of technology.
-
TRIZ analysis
Problem solution recognition through TRIZ analysis enabling you to find multiple solutions for a peculiar problem or vice versa!
-
Emerging technologies
It shows a chart of emerging technologies to help you focus on innovation strategies and related decision making.
We provide client-specific analytical reports on technology landscape in requested, convenient formats (Excel, Word or PDF). Having identified the purpose of the analysis, we cater to a range of requirements in one detailed analysis report.